

AI trend-report agent
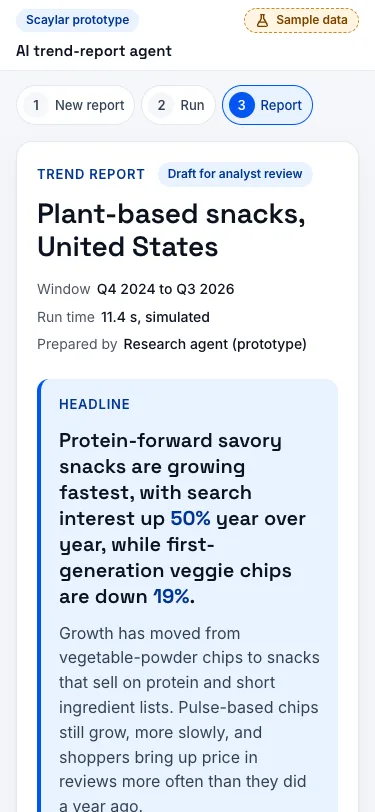
Prototype, sample dataThis is a Scaylar prototype built to show how an AI trend-report agent works, with sample data on screen. It splits a trend report on a product category into steps that can each be checked: scope the questions, gather signals, compute the figures in code, draft the report, and compare every figure in the draft with the data. The findings, figures and sources are made up, and the prototype calls no AI service: each run is replayed on timers in your browser.
( USE CASE )
Who it is for and the problem
Market research and consumer-intelligence teams that publish trend reports on product categories: which parts of a category are growing, how fast, and why.
Today an analyst spends days on each report. They pull news coverage, search interest, retail listings and social mentions from separate tools, line the numbers up in a spreadsheet, write the story, then check every figure by hand before it goes out. Much of that time goes to gathering and checking rather than to judgment.
The agent takes on the gathering, the arithmetic and the first draft, and keeps a record of where every number came from. The analyst reviews a draft instead of starting from a blank page.
( STEP BY STEP )
How it works
The steps describe how a production build would work. The prototype plays them back with sample data and timers.
Step 01
Scope the questions
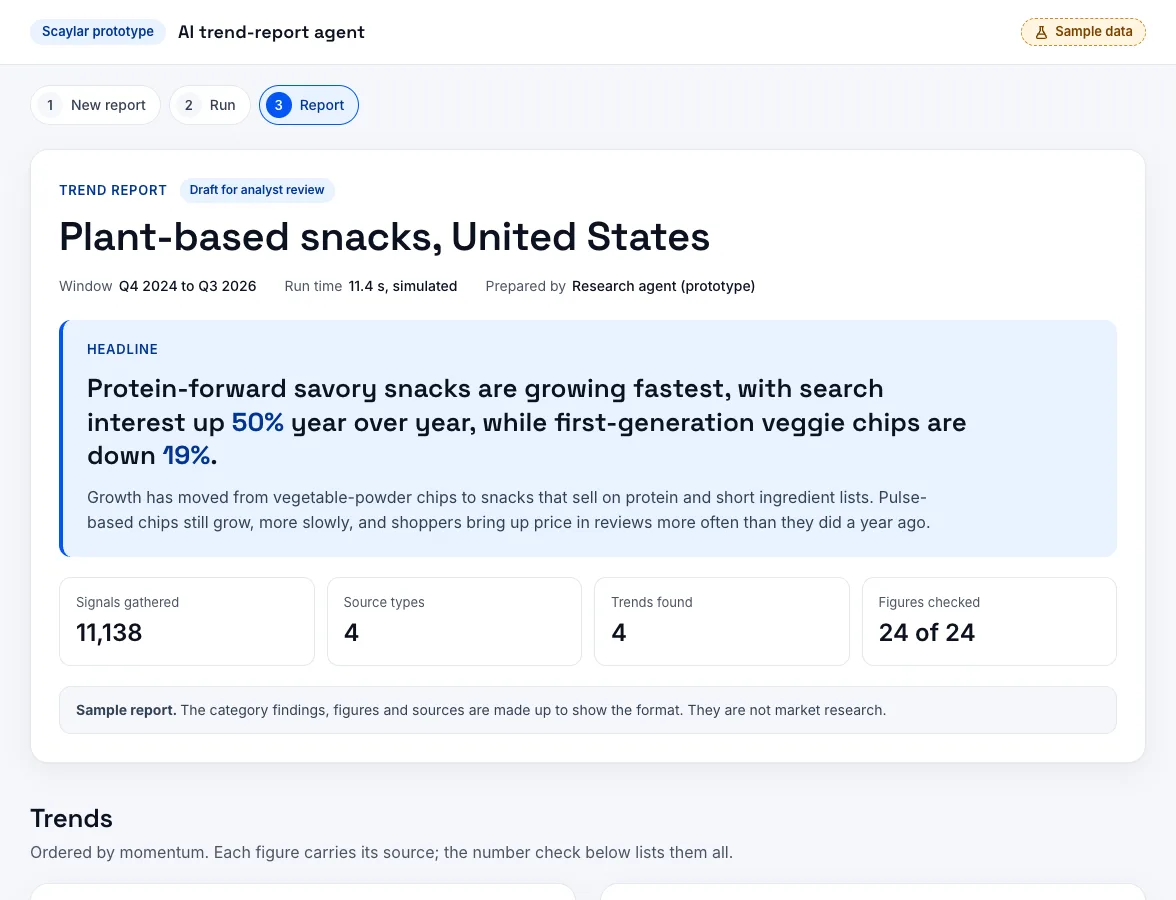
An analyst picks a category, a market and a time window. The agent turns that brief into a fixed set of questions: which parts of the category are growing, whether growth is speeding up, which products are taking share and what is driving it. It also lists the sub-segments it will track, so the scope is written down before any data is pulled.
Step 02
Gather signals
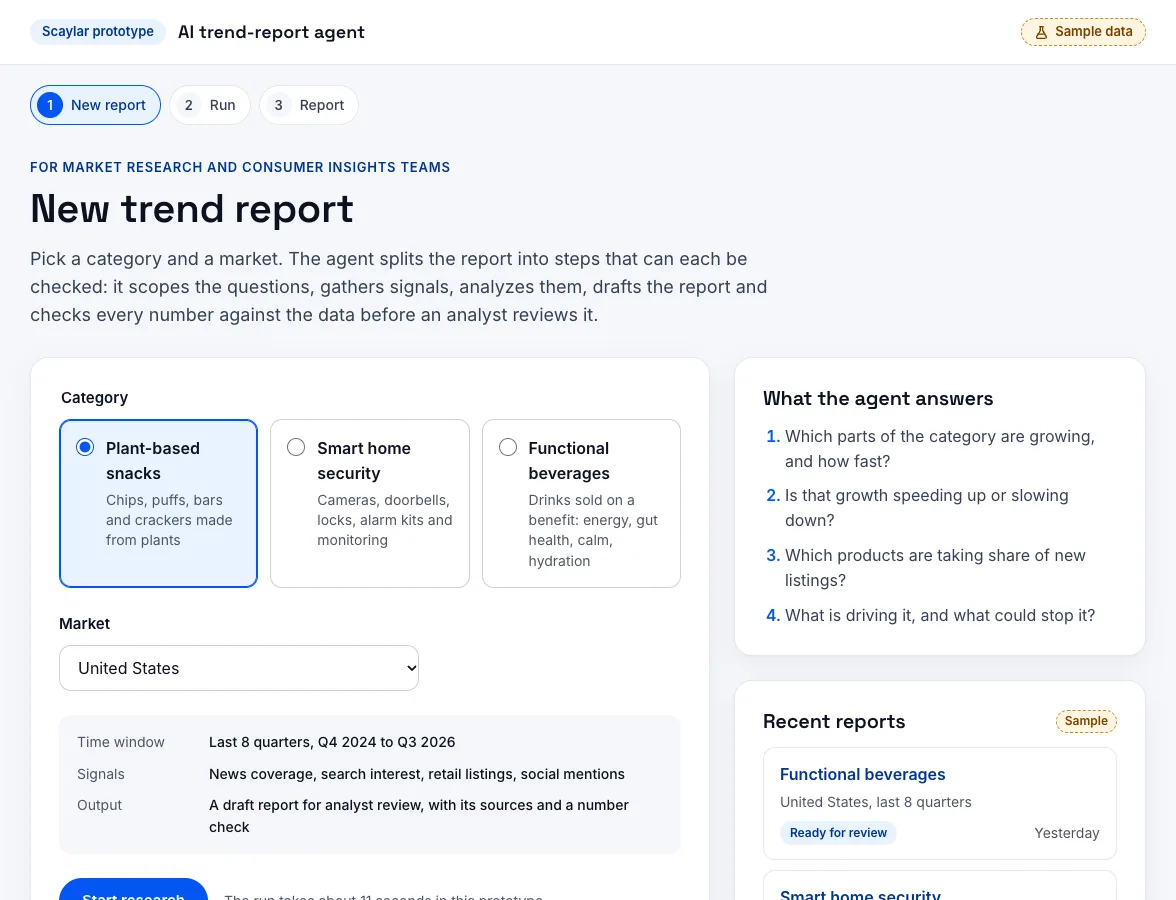
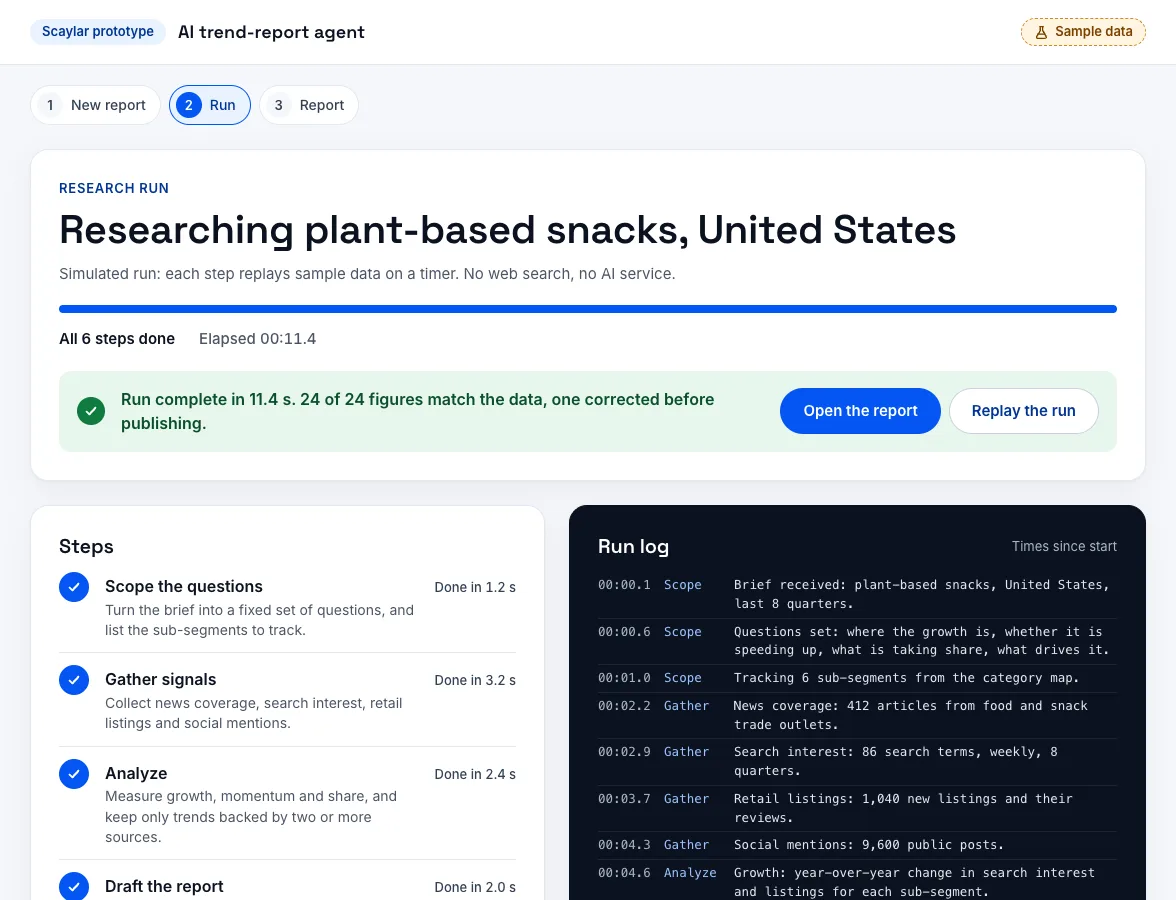
The agent collects news coverage, search interest, retail listings and social mentions for each sub-segment. Every step and every source goes into a run log with its time, so anyone can see what was read and when. In the prototype the run is replayed from sample data on a timer, and nothing is fetched.
Step 03
Analyze growth and momentum in code
In a production build, growth, momentum and share are computed in code from the collected series, not estimated by the model. Year-over-year change, the last two quarters against the two before, and share of new listings come out as numbers with their source attached, and a trend makes the report only when two or more sources back it. In the prototype these figures are sample values, written to show the format.
Step 04
Draft the report
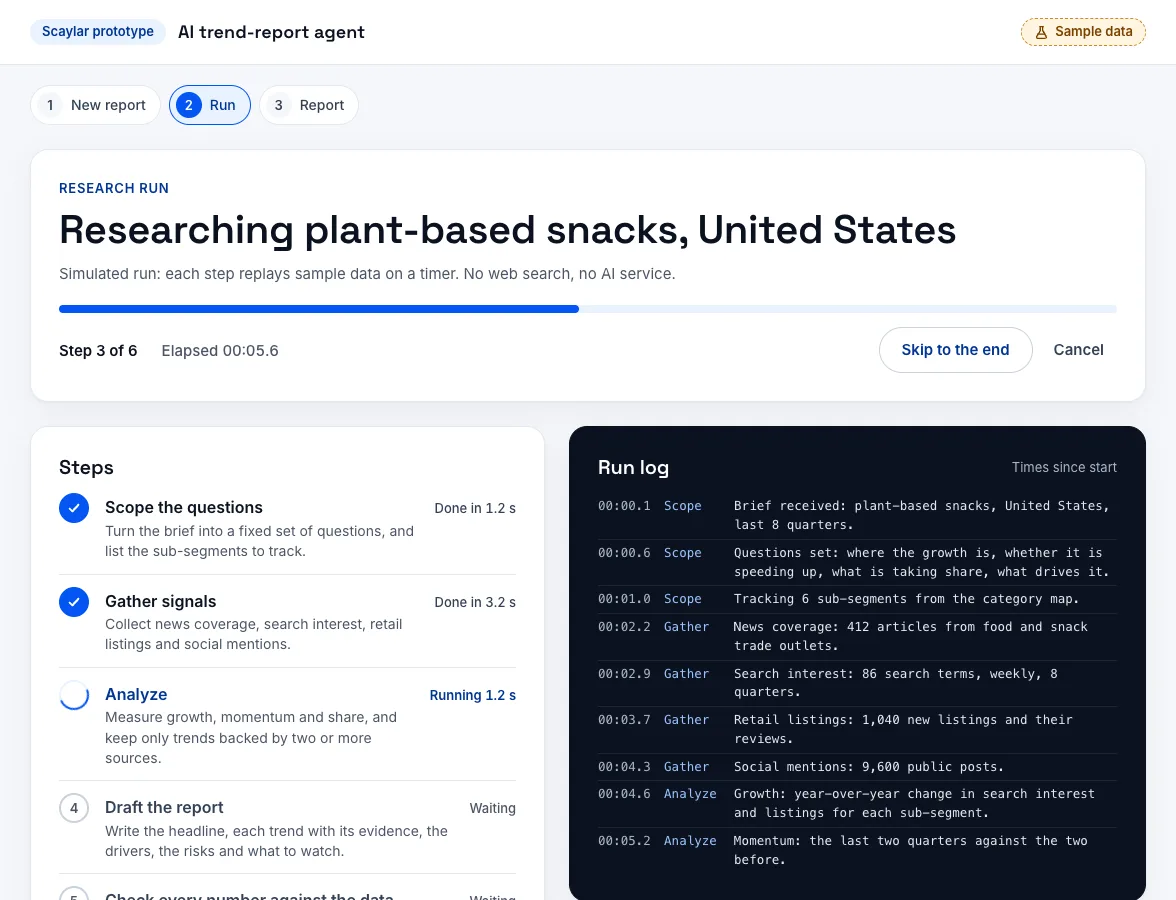
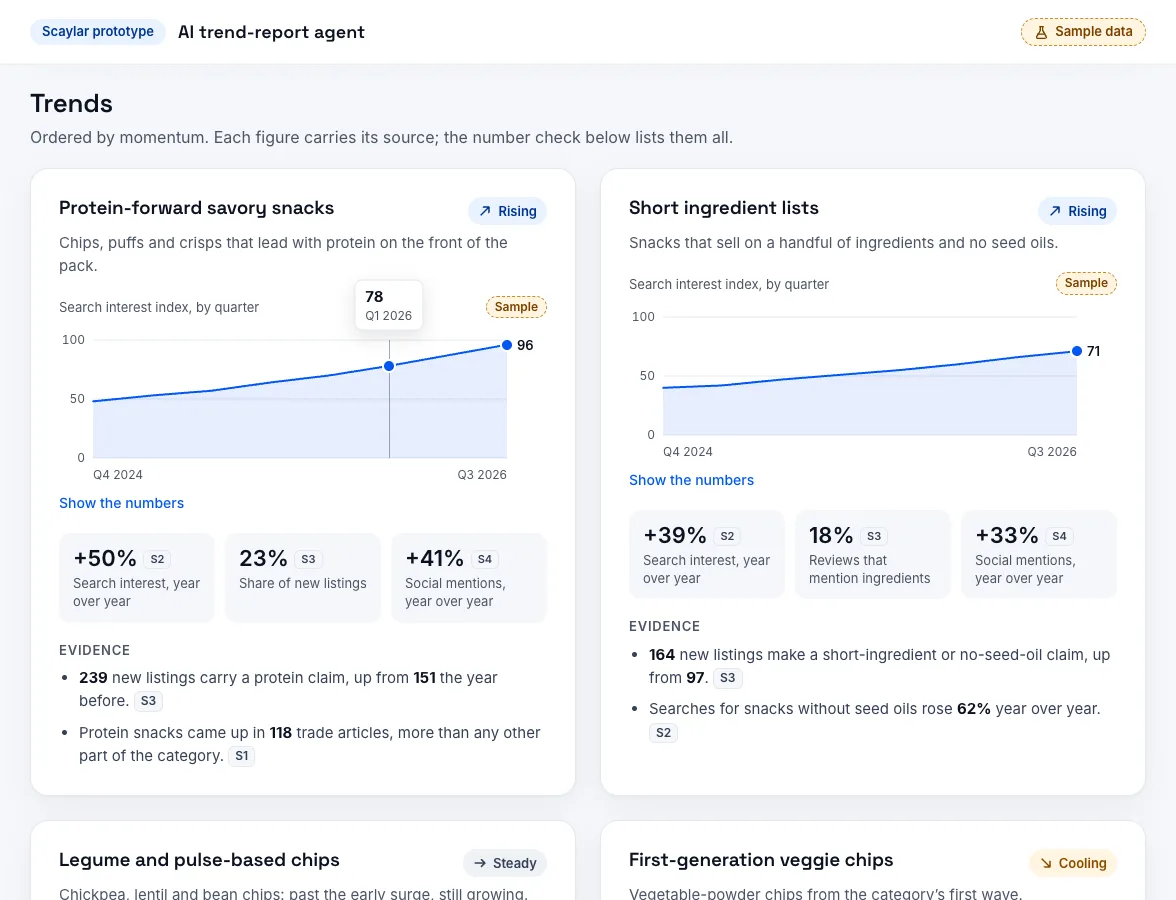
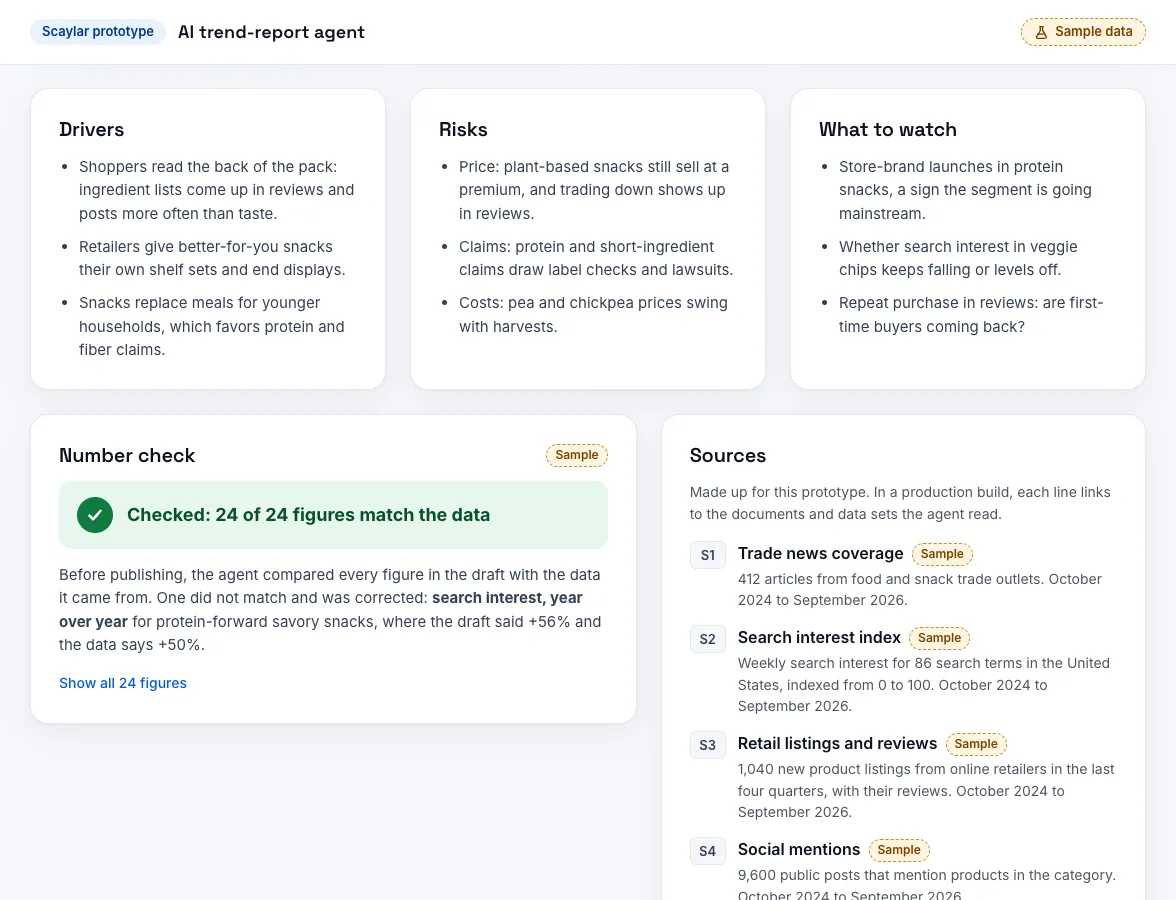
In a production build, the model writes the headline, one card per trend with its chart and evidence, the drivers, the risks and what to watch. It may only use figures from the computed series, and each figure keeps a tag that points to its source. The draft is marked for analyst review, not published.
Step 05
Check every figure against the data
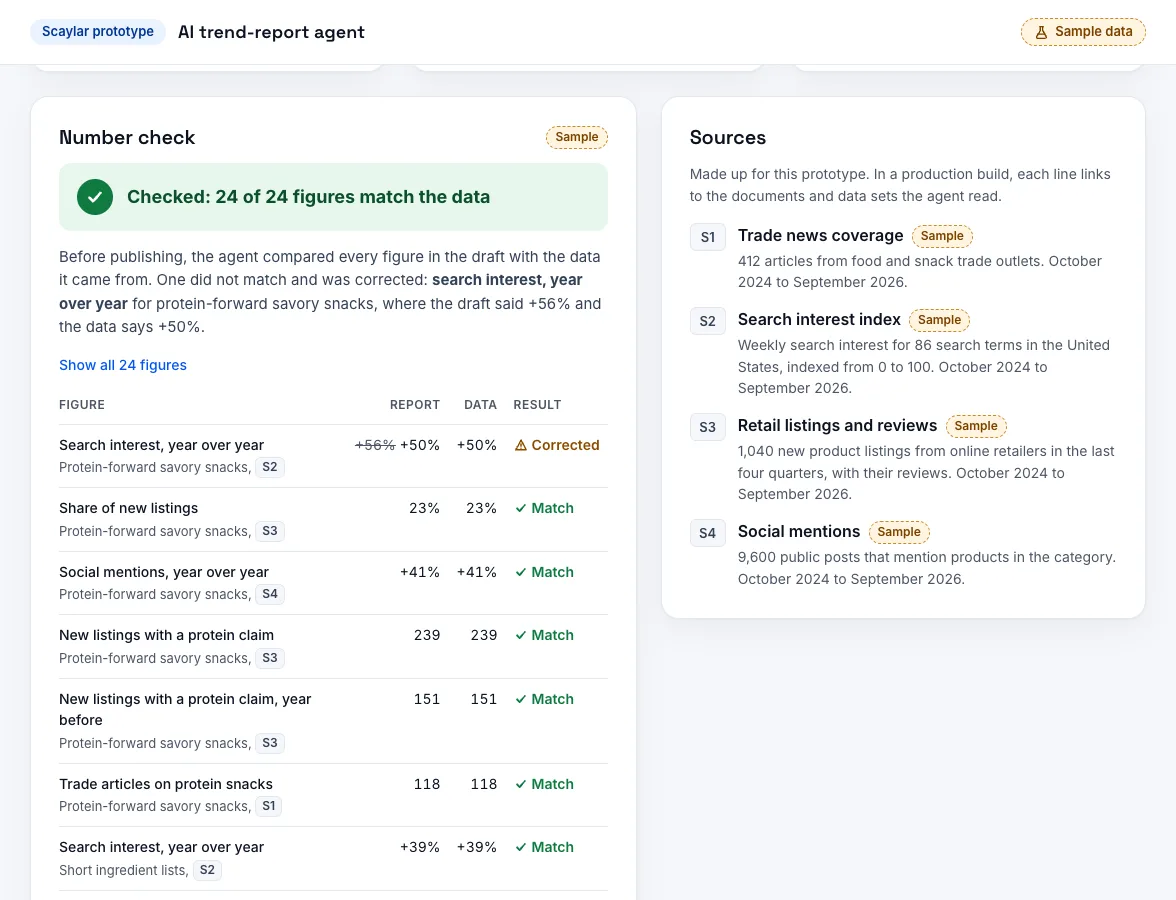
Before anyone reads the draft, a production build compares every figure in the text with the data it came from. A figure that does not match is corrected and flagged, so the reviewer sees what changed and why. In the sample run one figure did not match, and the screen shows it crossed out next to the corrected value.
Step 06
Publish, after an analyst signs off
When the checks pass, the run ends with the report ready to open, its sources and the full number check attached. An analyst reads it, edits what needs judgment and publishes it. Every report keeps its run log, so a question about any number can be answered later.
( WHAT WE AIM FOR )
Targets for a production build
What a production build would be designed and measured against. They are targets, not results: the prototype runs on sample data.
- Target: a draft ready for review in under an hour.
- Target: a few dollars in model costs per report, logged with each run.
- Target: every figure in the report traced to a source or a computed series.
( THE BUILD )
What we would build it with
A large language model (LLM)
For scoping the questions and writing the draft. The model writes the words; the numbers come from code.
Your own data sources
The news, search, retail and social data your team already licenses, read through their APIs or exports, with your past reports as examples of the house style.
Analysis in code
Scheduled Python jobs that compute growth, momentum and share from the collected series, so every figure can be recomputed and checked.
A review step
Every report lands as a draft for an analyst, with the number check and the sources beside it. Nothing is published until a person signs off.
Logs and cost tracking
Each run keeps its log, its sources and its model cost, so you can see what a report cost and trace any figure back to where it came from.
( OUR WORK )
Built on work we have shipped
- An executive dashboard that replaced a paid BI tool for a performance marketing agency.
- About thirty scheduled checks across that agency’s ad accounts, replacing a daily manual sweep.
Open the prototype
It runs in your browser on sample data: nothing you click or type is sent anywhere. If you have a process like this one, book a call and we will tell you plainly whether an agent is the right tool for it.
More case studies: AI learning guide · AI interview agent